Abstract
Monitoring and diagnosis of an out of control signals in manufacturing processes has become more challenging when it involves two or more correlated variables. In any production process and in the manufacturing industry, regardless of how well designed or carefully maintained it is, a certain amount of inherent or natural variability will always exist. The natural variability is the cumulative effect of many small, essentially unavoidable causes. A process that is operating with only chance causes of variation present is said to be in statistical control. In this paper we propose a method for approaching this problem based on principal components analysis. The principal component analysis method based on the ratios form was used to investigate which of the variable(s) were responsible for the out-of-control signal. A display of matrix of scatter plots was applied to investigate the correlation between the process variables and ellipses were used an approximate control limits. The principal component scores were used as an empirical reference distribution to establish a control region for the process to detect the variables causing the out-of-control signal. These insights derived from the principal component analysis offered valuable cues for identifying potential signals of an out-of-control process. The study findings indicated distinctive patterns of variance within the data, shedding light on potential signals for an out-of-control process.
Keywords
Process Control, Identification, Out-of-Control Signals, Principal Components Analysis
1. Introduction
Multivariate statistical process control (MSPC) techniques have long been integral to industry for evaluating process stability and final product quality. These techniques are crucial in monitoring and maintaining the desired quality levels in manufacturing processes, which are inherently subject to some degree of variability. This variability is acceptable when it is small and caused by random, unidentified factors, a condition defined by
| [1] | Montgomery, C. D (2001). Designs and analysis of the experiments, 5th edition, Arizon State University. |
[1]
as a statistically in-control process. However, excessive variability introduced by systematic factors renders a process out-of-control, necessitating rigorous statistical process monitoring (SPM) to detect and address these anomalies.
The research by
| [10] | J. Yu., L. Xi., & X. Zhou, (2009). “Identifying source(s) of out-of-control signals in multivariate manufacturing processes using selective neural network ensemble,” Engineering Applications of Artificial Intelligence, vol. 22, no. 1, pp. 141–152. |
[10]
found that Control charts, the cornerstone of SPM provide a graphical representation of sample values related to product quality over time or across sample numbers. These charts are essential for visualizing and analyzing the process behavior, identifying variations that exceed normal levels. According to
| [7] | Bodnar, O., & Schmid, W. (2011). For monitoring the mean of a multivariate Gaussian process. Journal of Statistical Planning and Inference, 141(6), 2055–2070. |
[7]
variability in key quality characteristics typically originates from three primary sources: improperly adjusted or controlled machinery, operator errors, or defective raw materials. Such variability, larger than the background noise, signifies an unacceptable level of process performance and is classified as assignable causes of variation.
| [9] | Doganaksoy N., Faltin FW., & Tucker WT. (1991) Identification of out-of-control multivariate characteristic in a multivariable manufacturing environment. Communications in Statistics- Theory and Methods, 20: 2775-2790. |
[9]
when a process operates in the presence of assignable causes, it is deemed out-of-control, necessitating immediate corrective actions to restore stability.
In recent years, the study by
| [11] | Kourti T. (2005) Application of latent variable methods to process control and multivariate statistical process control in industry. International Journal of Adaptive Control and Signal Processing; 19: 213–246. |
[11]
recognized that the focus of research has shifted towards identifying the specific out-of-control variables after a multivariate control chart signals an anomaly. Traditional univariate methods fall short in complex industrial settings where multiple interrelated quality characteristics need monitoring simultaneously. The study by
| [12] | Tai-Fu Li, Sheng Hu, Zheng-yuan Wei, and Zhi-qiang Liao. A, (2013) Framework for Diagnosing the Out-of-Control Signals in Multivariate Process Using Optimized Support Vector Machines. |
[12]
proposed leveraging Principal Component Analysis (PCA) to identify the specific variables responsible for out-of-control signals in multivariate settings. CA is a powerful statistical tool that reduces data dimensionality while retaining most of the variation present in the dataset, making it easier to detect patterns and pinpoint sources of variation as outlined by
| [14] | Ku W, Storer RH, Georgakis C. (1995) Disturbance detection and isolation by dynamic principal component analysis. Chemometrics and Intelligent Laboratory Systems, 30: 179–196. |
[14]
.
Pioneering work by
| [3] | Maravelakis, PE., Bersimis, S., Panaretos J., & Psarakis, S (2002). On identifying the out of control variable in a multivariate control chart. Communications in Statistics - Theory and Methods, 31: 2391-2408. |
[3]
introduced a PCA-based method for identifying out-of-control variables in multivariate control charts. This method includes deriving theoretical control limits, step-by-step procedural instructions, and a comprehensive evaluation of its strengths and weaknesses. It also offers a graphical technique to address limiting situations and demonstrates superior performance compared to existing PCA methods, largely due to its reduced computational burden.
Research by
| [2] | Mohamed H Abo-Hawa., MS El-Din., OA Nada., & S El-Kom, (2016). Monitoring production processes using multivariate control charts, International Journal of Advanced Engineering and Global Technology. |
[2]
further emphasized the importance of checking for autocorrelation before applying control charts, as correlated data points can lead to misleading results, such as increased false alarm rates and masked actual correlations between variables. Addressing autocorrelation is crucial for accurate multivariate control chart analysis, ensuring that the identified signals accurately reflect process deviations.
In the context of the Tumaini Mabati Company's iron sheet production process, a high defect rate has been observed, including issues like uneven thickness, surface imperfections, and inadequate tensile strength. These defects lead to material waste, higher production costs, customer complaints, and potential financial losses. This study aims to employ PCA to identify the variable(s) contributing to the out-of-control signals in the company's production process. By pinpointing the exact sources of variability, the company can implement targeted interventions to enhance process stability and product quality, ultimately reducing defect rates and improving overall operational efficiency.
2. Methods
2.1. Data and Simulation Procedure
A secondary data set from Tumaini Mabati manufacturing company, focusing on box profile iron sheets was used for this analysis. The goal was to determine if the sheets met quality standards.
The principal components analysis (PCA) procedure was demonstrated using data on four process variables from a manufacturing process. The first 20 observations from the manufacturing process were plotted against each other in a pairwise manner to obtain a display known as a matrix of scatter plots. The PCA on 20 observation were predicted showing the eigenvalues and Eigen vectors. A scatter plot of the first 20 principal components scores and were also plotted. Future 10 new observations on the process variables were obtained and their principal component scores computed and plotted on a control chart. The principal component scores for the new observations were plotted in a different control chart which was used to assist in identifying the scores of the new points.
2.2. PCA for Dimensionality Reduction
According to
| [8] | B. M. Wise., N. L. Ricker., D. J. Veltkamp &B. R. Kowalski, (1990).“A Theoretical Basis for the Use of Principal Components Models for Monitoring Multivariate Processes,” Process Control and Quality, vol. 1, no. 1, pp. 41-51. |
[8]
, a
symmetric, nonsingular matrix, such as the variance-covariance matrix Σ, is reduced to a diagonal matrix L by premultiplying and postmultiplying it by a particular orthonormal matrix
such that
the diagonal elements of L,
are the characteristic roots, or eigenvalues of Σ. The columns of U are the characteristic vectors, or eigenvectors of Σ. The study by
| [13] | Psarakis, S. and Papaleonida, G. E. A. (2007). SPC Procedures for Monitoring Autocorrelated Processes, Quality Technology and Quantitative Management, Vol. 4(4), pp. 501-540. |
[13]
on PCA transforms
correlated variables
into
new uncorrelated ones. The main advantage of this method is the reduction of dimensionality. The first few principal components (PCs) typically capture most of the process variability as stated by
| [6] | Runger GC, Alt FB, Montgomery DC. (1996) Contributors to a multivariate SPC chart signal. Communications in Statistics - Theory and Methods, 25: 2203-2213. |
[6]
allowing us to focus on these instead of all original variables.
2.3. Proposed Method
Assuming that denote the observation (vector) for the variables of a process. Let be a -dimensional normal distribution (), where is the vector () of known means and is the known () variance-covariance matrix.
The PCA model applied is defined as
Where is the PC, is the corresponding eigenvector and are the process variables.
The score for vector in PC is
When an out-of-control signal in the control chart is detected, the study used principal component analysis to identify the variable or variables that were responsible. For this objective one methodology was developed for the case that the covariance matrix has only positive correlations.
2.4. Covariance Matrix with Positive Correlations
In the case where all the variables are positively correlated the first two PCs are weighted average of all the variables. According to
| [4] | Jackson JE (1991). A user guide to principal components; John Wiley: New York. |
| [5] | Runger, G. C.; Alt, F. B. (1996). Choosing Principal Components for Multivariate SPC. Communications in Statistics A-(Theory and Methods), 25, 909–922. |
[4, 5]
, one of the existing methods for choosing principal components was to choose
significant PCs. The method for the study is based on the ratios of the form:
Where is the value of variable is the score of the vector of observations in the PC.
In the ratio, the numerator corresponds to the sum of the contributions of variable
in the first
d PCs in observation (vector)
whereas the denominator is the sum of scores of observation (vector)
in the first
PCs. The rationale of this method is to compute the impact of each of the
variables on the out-of-control signal by using its contribution to the total score. A multivariate chart is used when there is at least moderate and usually large correlation between the variables as outlined by
| [15] | Hayter AJ, Tsui K-L. (1994), Identification and quantification in multivariate quality control problems. Journal of Quality Technology, 26: 197-208. |
[15]
. Under such circumstances the first
PCs account for the largest part of the process variability.
3. Result and Discussion
3.1. Residuals Versus the Process Variables
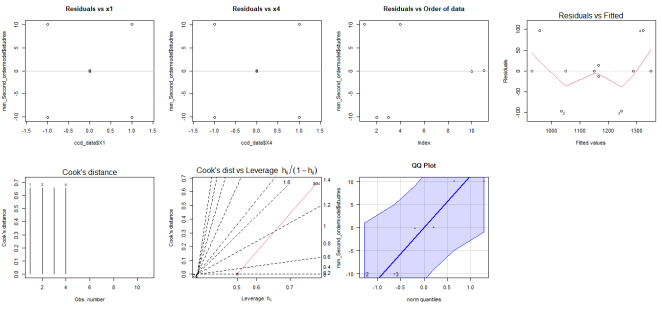
The findings reveal a normal quantile-quantile (QQ) plot of the residuals versus the process variable. The data points roughly follow a straight line, indicating that the residuals are normally distributed, which is a good assumption for normality statistical tests as shown in
figure 1.
3.2. Residuals Versus Order of Data
This scatter plot showed the residuals plotted against the order in which the data were collected. Ideally, there should be no pattern in this plot, indicating that the order in which the data were collected did not affect the results. The plot seems to show some randomness, which a good sign of the data analysis is as indicated in
figure 1.
3.3. Residuals Versus Fitted Values
This scatter plot displays the residuals versus the fitted values of the response variable. In an ideal scenario, the residuals should be randomly scattered around the horizontal line at zero, with no discernible pattern. This plot seems to show a nearly straight line, suggesting that the model perfectly captures the relationship between the factors and the response as shown in
figure 1.
Figure 1. Residuals versus Order of data; fitted values and cooks distance.
3.4. Cook's Distance
This plot shows Cook's distance for each observation. Cook's distance is a measure of how influential each data point is on the fitted model. High Cook's distance values indicate observations that may have a large impact on the model and potentially warrant further investigation. The plot showed a few data points with higher Cook's distance, indicating the observations that may have a large impact on the model as shown in
figure 1.
3.5. Summary Statistics for the Variables of the Study
A standard normal distribution of data assists in creating reliable and accurate conclusions. Goodness of fit test for Skewness and Kurtosis test were used to find the normality of the data. This part shows important descriptive statistics of the data comprising of the mean, standard deviation, coefficient of variation, skewness, and kurtosis values of Pressure of the press of the rollers, flow of the hydraulic fluid, power applied to digital setting and spacing between the anode and the cathode wheel encoder (gap).
The data of Pressure of the press of the rollers, flow of the hydraulic fluid, power applied to digital setting and spacing between the anode and the cathode wheel encoder (gap) was normally distributed since their skewness and kurtosis test values were falling within the range of ±3 and ±1 respectively.
Table 1. Summary statistics for the variables of the study.
Response | Mean | Standard deviation | Median | Skewness | Kurtosis |
Pressure of the rollers | 13.508 | 9.8752 | 10.3 | 1.3061 | 1.1803 |
Flow of the hydraulic fluid | 4.2037 | 1.5807 | 4 | 0.4529 | -0.3893 |
Power applied to digital setting | 4.5802 | 3.1657 | 4 | 1.3371 | 1.1981 |
Spacing between the anode and the cathode wheel encoder (Gap) | 14.6550 | 3.0755 | 4 | 0.3263 | -0.4292 |
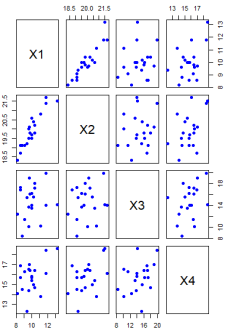
3.6. Matrix of Scatter Plots for Process Variables
The plots indicate that the first two variables, pressure (
) and flow (
) are highly corrected and the other two exhibit moderate correlation as shown in
figure 2.
Figure 2. Matrix of Scatter plots for the first 20 observations.
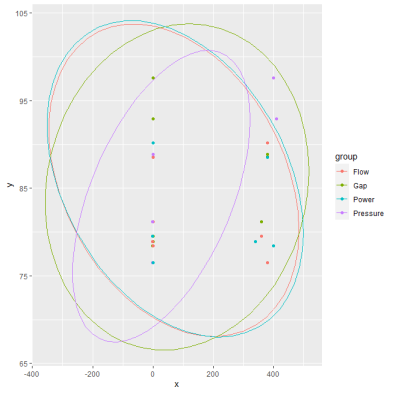
3.7. Control Chart for Phase I
Figure 3 illustrates a scatter plot for the first 20 0bsevation principal component score along with 95% confidence contour. The scores were used as an empirical reference distribution to establish a control region for the process. It is evident that all the scores of
and
are inside the ellipses indicating that the process is in control phase.
Figure 3. Scatter plot of the first 20 principal component scores and .
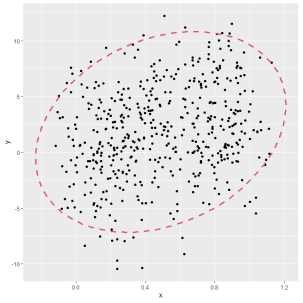
3.8. Control Chart for Phase II
The first few new scores are inside the ellipse while some other principal component scores are outside the ellipse. This shows that there has been a shift in the process mean hence evidence for the signal that the process is on an out of control state.
Table 2. Eigen Values.
| Eigenvalues | Percentage | Cumulative Percentage |
PC1 | 2.36083004 | 59.020751 | 59.02075 |
PC2 | 1.02865177 | 25.716294 | 84.73705 |
PC3 | 0.53629105 | 13.407276 | 98.14432 |
PC4 | 0.07422714 | 1.855679 | 100.00000 |
Figure 4. Principal components scores for the new observations.
The analysis unveiled that the first principal component (PC1) accounted for the highest eigenvalue of 2.36083004, representing approximately 59.02% of the total variance. The second PC exhibited an eigenvalue of 1.02865177, contributing to approximately 25.72% of the total variance. The first two components cumulatively explained about 84.74% of the variance, signifying a substantial portion of the dataset's variability. The third principal component (PC3) demonstrated an eigenvalue of 0.53629105, representing approximately 13.41% of the total variance. When combined with PC1 and PC2, these three components captured approximately 98.14% of the total variance, indicating a comprehensive representation of the data set's variability.
Table 3. Eigen vectors.
| X1 | X2 | X3 | X4 |
PC1 | 0.5965972 | 0.3071659 | -0.2174849 | -0.708816752 |
PC2 | 0.5923728 | 0.3288784 | -0.2088775 | -0.705197616 |
PC3 | 0.2642171 | 0.8266595 | 0.4965390 | -0.016505466 |
PC4 | 0.4726051 | 0.3378198 | -0.8139530 | -0.001644521 |
The Eigen vector table, it is evident that each principal component captures distinct patterns of variance within the data. For instance, in PC1, positive coefficients for and suggest a strong positive association, implying that variations in these variables contribute significantly to the variance captured by PC1. Similarly, in PC2, while and still exhibit positive coefficients, the negative coefficients for and indicate an inverse relationship with PC2, suggesting that changes in these variables contribute negatively to the variance explained by PC2. The Eigen vectors reveal the varying degrees of influence each original variable has on different principal components. For instance, demonstrates a strong positive association with PC3, as indicated by its high positive coefficient, while exhibits a weaker but still positive association. Conversely, displays an inverse relationship with PC3, as evidenced by its negative coefficient.
4. Conclusions and Recommendations
4.1. Conclusion
The methodology for determining an in-control state in the manufacturing process was straightforward: it involved verifying whether the data point representing the current process state fell within the designated target range. This initial check served as a simple yet effective measure to ascertain process stability. However, when out-of-control signals were detected, the study delved deeper into additional diagnostic displays to pinpoint the sources of variation causing these signals. This thorough examination was crucial for accurately identifying the root causes of deviations from the desired process state.
A pivotal part of this diagnostic approach was the use of principal component analysis (PCA). PCA provided critical insights by highlighting patterns and correlations within the data that might not be immediately apparent. These insights were instrumental in recognizing potential signals indicating an out-of-control process. By leveraging PCA, the study was able to develop more robust detection procedures, ensuring a higher level of accuracy in identifying and addressing issues within the manufacturing process of iron sheets.
Ultimately, the combination of simple in-control state checks and advanced analytical techniques like PCA contributed to a more effective and reliable process control system. This integrated approach not only enhanced the detection of out-of-control signals but also facilitated timely and precise interventions, leading to improvements in the overall quality and consistency of the manufactured iron sheets.
4.2. Recommendations
An interesting areas for further research in the domain of multivariate statistical process control are robust design of control charts and nonparametric control charts. The research for multivariate attributes control charts is also a promising task. Further research need to be done, if more than two principal components need to be retained, because the interpretation and use of the charts becomes cumbersome. Furthermore, interpretation of the principal components can be difficult, because they are not the original set of process variables but instead linear combinations of them. The control charts and trajectory plots based on principal component analysis was most effective in detecting shifts in the directions defined by the principal components. Shifts in other directions, particularly directions orthogonal to the retained principal component directions, may be very hard to detect hence the need for further research.
Abbreviations
PCA | Principal Components Analysis |
MSPC | Multivariate Statistical Process Control |
SPM | Statistical Process Monitoring |
PCs | Principal Components |
Author Contributions
Martin Kyalo Mung’au: Conceptualization, Data curation, Formal Analysis, Funding acquisition, Investigation, Methodology, Resources, Software, Validation, Visualization, Writing – original draft, Writing – review & editing
Hellen Wanjiru Waititu: Conceptualization, Data curation, Formal Analysis, Funding acquisition, Methodology, Project administration, Resources, Software, Supervision, Validation, Visualization, Writing – review & editing
Nyakundi Omwando Cornelious: Conceptualization, Data curation, Formal Analysis, Funding acquisition, Methodology, Project administration, Resources, Software, Supervision, Validation, Visualization, Writing – review & editing
Conflicts of Interest
The authors declare no conflicts of interest.
References
| [1] |
Montgomery, C. D (2001). Designs and analysis of the experiments, 5th edition, Arizon State University.
|
| [2] |
Mohamed H Abo-Hawa., MS El-Din., OA Nada., & S El-Kom, (2016). Monitoring production processes using multivariate control charts, International Journal of Advanced Engineering and Global Technology.
|
| [3] |
Maravelakis, PE., Bersimis, S., Panaretos J., & Psarakis, S (2002). On identifying the out of control variable in a multivariate control chart. Communications in Statistics - Theory and Methods, 31: 2391-2408.
|
| [4] |
Jackson JE (1991). A user guide to principal components; John Wiley: New York.
|
| [5] |
Runger, G. C.; Alt, F. B. (1996). Choosing Principal Components for Multivariate SPC. Communications in Statistics A-(Theory and Methods), 25, 909–922.
|
| [6] |
Runger GC, Alt FB, Montgomery DC. (1996) Contributors to a multivariate SPC chart signal. Communications in Statistics - Theory and Methods, 25: 2203-2213.
|
| [7] |
Bodnar, O., & Schmid, W. (2011). For monitoring the mean of a multivariate Gaussian process. Journal of Statistical Planning and Inference, 141(6), 2055–2070.
|
| [8] |
B. M. Wise., N. L. Ricker., D. J. Veltkamp &B. R. Kowalski, (1990).“A Theoretical Basis for the Use of Principal Components Models for Monitoring Multivariate Processes,” Process Control and Quality, vol. 1, no. 1, pp. 41-51.
|
| [9] |
Doganaksoy N., Faltin FW., & Tucker WT. (1991) Identification of out-of-control multivariate characteristic in a multivariable manufacturing environment. Communications in Statistics- Theory and Methods, 20: 2775-2790.
|
| [10] |
J. Yu., L. Xi., & X. Zhou, (2009). “Identifying source(s) of out-of-control signals in multivariate manufacturing processes using selective neural network ensemble,” Engineering Applications of Artificial Intelligence, vol. 22, no. 1, pp. 141–152.
|
| [11] |
Kourti T. (2005) Application of latent variable methods to process control and multivariate statistical process control in industry. International Journal of Adaptive Control and Signal Processing; 19: 213–246.
|
| [12] |
Tai-Fu Li, Sheng Hu, Zheng-yuan Wei, and Zhi-qiang Liao. A, (2013) Framework for Diagnosing the Out-of-Control Signals in Multivariate Process Using Optimized Support Vector Machines.
|
| [13] |
Psarakis, S. and Papaleonida, G. E. A. (2007). SPC Procedures for Monitoring Autocorrelated Processes, Quality Technology and Quantitative Management, Vol. 4(4), pp. 501-540.
|
| [14] |
Ku W, Storer RH, Georgakis C. (1995) Disturbance detection and isolation by dynamic principal component analysis. Chemometrics and Intelligent Laboratory Systems, 30: 179–196.
|
| [15] |
Hayter AJ, Tsui K-L. (1994), Identification and quantification in multivariate quality control problems. Journal of Quality Technology, 26: 197-208.
|
Cite This Article
-
ACS Style
Mung’au, M. K.; Waititu, H. W.; Cornelious, N. O. Identification of the Out-of-Control Variable on a Multivariate Control Chart Signals in Iron Sheet Production Process. Eng. Math. 2024, 8(1), 1-7. doi: 10.11648/j.engmath.20240801.11
 Copy
|
Copy
|
 Download
AMA Style
Mung’au MK, Waititu HW, Cornelious NO. Identification of the Out-of-Control Variable on a Multivariate Control Chart Signals in Iron Sheet Production Process. Eng Math. 2024;8(1):1-7. doi: 10.11648/j.engmath.20240801.11
Copy
|
Download
-
@article{10.11648/j.engmath.20240801.11,
  author = {Martin Kyalo Mung’au and Hellen Wanjiru Waititu and Nyakundi Omwando Cornelious},
  title = {Identification of the Out-of-Control Variable on a Multivariate Control Chart Signals in Iron Sheet Production Process
},
  journal = {Engineering Mathematics},
  volume = {8},
  number = {1},
  pages = {1-7},
  doi = {10.11648/j.engmath.20240801.11},
  url = {https://doi.org/10.11648/j.engmath.20240801.11},
  eprint = {https://article.sciencepublishinggroup.com/pdf/10.11648.j.engmath.20240801.11},
  abstract = {Monitoring and diagnosis of an out of control signals in manufacturing processes has become more challenging when it involves two or more correlated variables. In any production process and in the manufacturing industry, regardless of how well designed or carefully maintained it is, a certain amount of inherent or natural variability will always exist. The natural variability is the cumulative effect of many small, essentially unavoidable causes. A process that is operating with only chance causes of variation present is said to be in statistical control. In this paper we propose a method for approaching this problem based on principal components analysis. The principal component analysis method based on the ratios form was used to investigate which of the variable(s) were responsible for the out-of-control signal. A display of matrix of scatter plots was applied to investigate the correlation between the process variables and ellipses were used an approximate control limits. The principal component scores were used as an empirical reference distribution to establish a control region for the process to detect the variables causing the out-of-control signal. These insights derived from the principal component analysis offered valuable cues for identifying potential signals of an out-of-control process. The study findings indicated distinctive patterns of variance within the data, shedding light on potential signals for an out-of-control process.
},
 year = {2024}
}
Copy
|
Download
-
TY  - JOUR
T1  - Identification of the Out-of-Control Variable on a Multivariate Control Chart Signals in Iron Sheet Production Process

AU  - Martin Kyalo Mung’au
AU  - Hellen Wanjiru Waititu
AU  - Nyakundi Omwando Cornelious
Y1  - 2024/09/11
PY  - 2024
N1  - https://doi.org/10.11648/j.engmath.20240801.11
DO  - 10.11648/j.engmath.20240801.11
T2  - Engineering Mathematics
JF  - Engineering Mathematics
JO  - Engineering Mathematics
SP  - 1
EP  - 7
PB  - Science Publishing Group
SN  - 2640-088X
UR  - https://doi.org/10.11648/j.engmath.20240801.11
AB  - Monitoring and diagnosis of an out of control signals in manufacturing processes has become more challenging when it involves two or more correlated variables. In any production process and in the manufacturing industry, regardless of how well designed or carefully maintained it is, a certain amount of inherent or natural variability will always exist. The natural variability is the cumulative effect of many small, essentially unavoidable causes. A process that is operating with only chance causes of variation present is said to be in statistical control. In this paper we propose a method for approaching this problem based on principal components analysis. The principal component analysis method based on the ratios form was used to investigate which of the variable(s) were responsible for the out-of-control signal. A display of matrix of scatter plots was applied to investigate the correlation between the process variables and ellipses were used an approximate control limits. The principal component scores were used as an empirical reference distribution to establish a control region for the process to detect the variables causing the out-of-control signal. These insights derived from the principal component analysis offered valuable cues for identifying potential signals of an out-of-control process. The study findings indicated distinctive patterns of variance within the data, shedding light on potential signals for an out-of-control process.

VL  - 8
IS  - 1
ER  -
Copy
|
Download